Monday, August 4, 2008
Finding Equations of Lines in Photos
This is a set of applets I made using Geogebra. In each applet you fit linear equations, in slope-intercept form and point-slope form, to linear elements of photographs. The applets are all the same except that each uses a different photograph. I also developed a worksheet to go along with the applets, and it is included at the bottom of each applet.
Sunday, August 3, 2008
Graph
Graph, by Ivan Johansen, is a free, open-source program for Windows that allows you to quickly and easily graph functions while giving you a lot of control over the appearance of the output. The images can be easily pasted into a word processing document and I found that the quality of the printed output when I pasted into Word was quite good. An excellent feature is an option which will label tick marks with any specified multiple of pi.
In fact, the program allows you to do a lot more than make just pretty pictures. For example, you can graph (and obtain the equation of) the line tangent to a function at a specified point or fit a line to a set of points.
Thursday, July 31, 2008
David Young's Interactive Mathematics Resources
David Young has developed a high quality collection of interactive resources, primarily, but not solely, for algebra and pre-algebra. My favorites are the Graphing Linear Equations modules, which teach and then provide guided practice in graphing by plotting points, graphing using intercepts, and graphing using the slope-intercept method. A student worksheet to go along with these modules is provided as well. There's also lots worth exploring here beyond the applets. For example, there is a nice PowerPoint template for Jeopardy-style review and a video which shows you how to create your own applet using the free and versatile Geogebra.
Visualizing Fractions
In this applet from NCTM's Illuminations , you move sliders to adjust the numerator and the denominator of a fraction. The fraction, along with its decimal and percent representations are displayed above a visual representation of the fraction. You have three choices for the type of visual representation.
Sunday, July 27, 2008
Graph Explorer
HippoCampus
Saturday, July 26, 2008
Interactive Algebra Practice
This site offers an easy to use interface for practicing a fairly wide variety of math topics. I especially like the "graphing" and "formulas" in the algebra section. In these problems, if you choose a difficulty level of 5 or higher you can choose linear graphs, quadratic graphs or a mix. When you have finished the set number of problems, you have the opportunity to redo the problems you got wrong.
Friday, July 25, 2008
Thursday, July 24, 2008
Solving Linear Equations with Step-by-Step Checking
This is a very slick applet from WisWeb for providing practice solving linear equations (and showing your work!). You can use one of the 20 equations given or type in one of your own. Specify what you want to do to each side as the next step (e.g., add 4, combine like terms, distribute) and then do it. The applet will then indicate whether you have correctly carried out the operation you specified. Continue until the equation is solved.
There are a couple of other versions of this applet which have more practice problems, grouped by difficulty, but they do not include the option to enter your own equation. You can find them here and here.
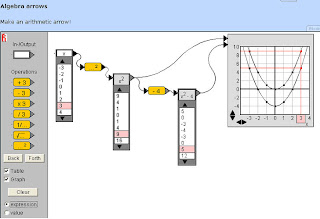
Algebra Arrows
This is a very cool applet from WisWeb for illustrating the building of an algebraic function and the relationship between tabular and graphical representations of the function. I didn't find much in the way of instructions on the website (much of which is in Dutch, though there is a more limited English version), but try this to build graphs and tables for y = x, y = x^2, and y = x^2 - 4:
1. Drag an In-/Output box to the main area of the applet and type an x in it.
2. Check both the Table and Graph check boxes. A table of values will appear with your In-/Output box and a blank graph will appear.
3. Drag the yellow "squared" operator into the main area.
4. Drag the arrow on the In-/Output box until it connects with the tiny gray dot on the operator box.
5. Add another In-/Output box and drag the operator arrow to connect with the little gray dot on this new box. The table below this box now shows the squares of all the values in the table below your original In-Output box.
6. Drag the arrow on the new In-/Output box over to the graph and the graph of y = x^2 appears. (Click and drag on the graph to see different portions of the graph and use the arrows to change the scales on the axes.) If you click one of the numbers in the tables, the corresponding number in the other table and the corresponding point on the graph will be highlighted.
7. Drag the subtraction operator into the main area and change its 3 to a 4.
8. Connect the x^2 In-/Output box to the subtraction operator.
9. Add another In-/Output box and connect the subtraction operator to it to see a table of values for x^2 - 4. Connect this new In-/Output box to the graph to show its graph as well as the original graph.
Wednesday, July 23, 2008
Algebra vs. the Cockroaches
In this game from Hotmath.com cockroaches crawl along a line in Cartesian coordinate system and you must type in the equation of the line to get rid of them. Equations get more difficult as the rounds progress.
Tuesday, July 22, 2008
Bloomington High School's Math Practice
I have used both the factoring practice and the radical practice successfully with my Algebra 1 students. Practice is also available for FOILing and times tables.
Larry Green's Line Graphing Applet
Sunday, July 20, 2008
Transum Software
This site has some good interactive activities appropriate for students in roughly grades 3 through 10. By clicking on the images here, you can experiment with those that I am most likely to use with my Algebra 1 class.
Subscribe to:
Posts (Atom)