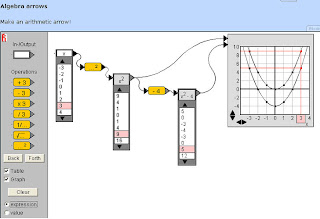
This is a very cool applet from WisWeb for illustrating the building of an algebraic function and the relationship between tabular and graphical representations of the function. I didn't find much in the way of instructions on the website (much of which is in Dutch, though there is a more limited English version), but try this to build graphs and tables for y = x, y = x^2, and y = x^2 - 4:
1. Drag an In-/Output box to the main area of the applet and type an x in it.
2. Check both the Table and Graph check boxes. A table of values will appear with your In-/Output box and a blank graph will appear.
3. Drag the yellow "squared" operator into the main area.
4. Drag the arrow on the In-/Output box until it connects with the tiny gray dot on the operator box.
5. Add another In-/Output box and drag the operator arrow to connect with the little gray dot on this new box. The table below this box now shows the squares of all the values in the table below your original In-Output box.
6. Drag the arrow on the new In-/Output box over to the graph and the graph of y = x^2 appears. (Click and drag on the graph to see different portions of the graph and use the arrows to change the scales on the axes.) If you click one of the numbers in the tables, the corresponding number in the other table and the corresponding point on the graph will be highlighted.
7. Drag the subtraction operator into the main area and change its 3 to a 4.
8. Connect the x^2 In-/Output box to the subtraction operator.
9. Add another In-/Output box and connect the subtraction operator to it to see a table of values for x^2 - 4. Connect this new In-/Output box to the graph to show its graph as well as the original graph.
No comments:
Post a Comment