
Showing posts with label GeoGebra. Show all posts
Showing posts with label GeoGebra. Show all posts
Saturday, August 4, 2018
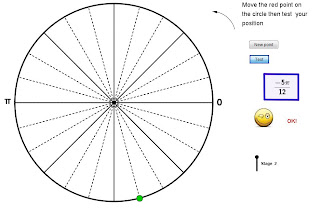
Unit Circle Practice
Saturday, August 26, 2017

Sunday, August 6, 2017
Domain of a Function defined by a Composition
I created this GeoGebra
 applet to help with visualization of the domain of a function defined by a composition.
Thursday, January 5, 2017
Snail's Trail Quilt Square
 I created this GeoGebra applet based on a quilt square pattern to use in a precalculus class as a visual introduction to the sum of an infinite geometric series. A nice accompaniment is this applet from Irina Boyadzhiev. I also created a Desmos activity with a focus on asking questions which incorporates these two applets.
Sunday, August 21, 2016
Visualizing radians
 Sam Shah shared a GeoGebra applet created by a colleage of his which does a beautiful job of demonstrating what a radian is. He wrote about it here. I made minor modifications, mostly so that the word radian doesn't actually appear. Here's that slightly modified version.
Saturday, May 2, 2015
Evaluating Inverse Trig Expressions
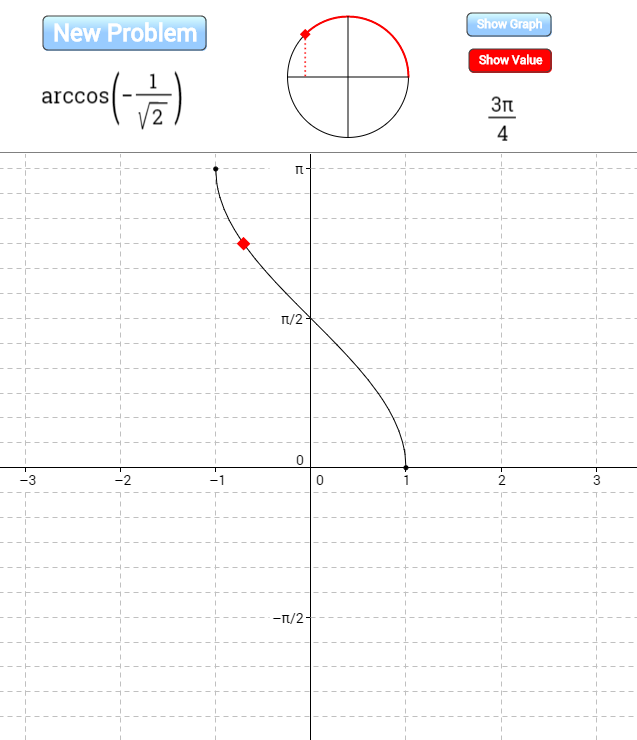 I created this applet on GeoGebraTube to help students practice evaluating inverse trig functions of special angles by visualizing both the unit circle and the graph of the inverse trig function.
Monday, March 30, 2015
Variation on John Golden's GeoGebra Ferris Wheel
 I love John Golden's GeoGebra Ferris Wheel, which he's written about here and I've written about here. I also love how GeoGebraTube makes it so easy to start with the great work of someone else and create a variation on it. Here's my variation on John's creation for a user who's slightly more experienced with transformations and with sine and cosine functions. Rather than asking the user to come up with parameters for a given function, it requires the user to come up with the whole function. I also added the option to hide the actual function so that the user could begin by thinking about what it would look like.
We had a great discussion in precalculus class today based on a single randomly generated wheel. We went wherever student questions and answers took us and ended up covering lots of ground. The particularly interesting stuff from my perspective came when those who saw the graph as a shifted sine wave were fighting it out with those who saw it as a shifted cosine wave and those who saw it as a flipped cosine wave. Finally lots of people were seeing lots of ways that they might write an equation for a sinusoidal wave. At the very end of class we generated a new wheel and everyone tried to write a function to go along with it. Class was over and people were pleading, "Please--try my equation!"
Sunday, March 22, 2015
Rotational and Reflectional Symmetry
 I used GeoGebra to create this applet for exploring the rotational and reflectional symmetry of a variety of images.
Friday, March 20, 2015
Euclid: The Game
 Complete with a high score list, Euclid: The Game, created by Kasper Peulen using GeoGebra, presents you with a series of compass and straightedge challenges which get progressively more difficult as you move through the levels. You earn a gold medal for completing a level in the minimum number of moves. See if you can get all the way from constructing an equilateral triangle to inscribing a pentagon in a circle!
Asymptotes of Rational Functions.
 Asymptotes of Rational Functions is a GeoGebra construction designed to help people explore the relationship between the equation of a rational function and its graph. You choose the rational function you'd like to explore. Here's a story of something neat that happened when I used it in class.
Friday, May 17, 2013
Intuitive Notion of the Limit - One-Sided Limits
 This applet, which is part of Marc Renault's GeoGebra Calculus Applets collection, provides an intuitive introduction to the idea of a limit of a function as x approaches c from the right, left, or both.
The red, green, and blue lines along the x-axis, y-axis and the function which shrink as you decrease δ help with the visualization of motion along the function toward the point where x = c and the corresponding motion toward the limiting values on the axes. Choose from the good library of example functions that are included or enter your own. (I like to start with my own rational function which looks linear but actually has an unseen hole to emphasize from the very beginning the difference between the value of a function and its limit at a point.)
When I used this with a class for the first time, my students asked to see the examples with "Exploding" in the title and they reacted audibly to the motion of the green lines on the y-axis as the function approached its asymptote. My experience has been that when introduced to the idea of limits on a graph there are always a few students who have a lot of difficulty visualizing the various ways in which certain things approach approach other things, and starting with this applet seemed to really help.
Friday, March 22, 2013
Operations on functions graphically

(Links updated 7/30/2016)
Finding logs

Inverse functions graphically

Monday, December 3, 2012
Radian measure practice
Thursday, July 26, 2012
Transforming f into g

In this applet (inspired by Steve Phelps' What's My Rule series) you select a parent function, f(x), from among 10 possibilities and click a button to indicate the maximum number of transformations (up to 4) that you'd like to have performed on f to produce a new function g. You see only one point on g, but you can move the corresponding point on f, to determine the relationship between the two. When you believe you have found the parameters that describe the transformation, you can show the graph of the transformed function that your parameters create and see if the lone point moves along it.
Here's a Java version of the applet.
Sunday, July 22, 2012
Ferris Wheel

Saturday, July 21, 2012
Napier's Gift

Monday, July 16, 2012
Visualizing Radian Measure

Saturday, July 7, 2012
Indiana Puzzle Quilt

Check out the pattern in some real quilts, too!
Update 1/5/2017: See the Snail's Trail Quilt Square
Subscribe to:
Posts (Atom)