
Showing posts with label functions. Show all posts
Showing posts with label functions. Show all posts
Sunday, August 6, 2017
Domain of a Function defined by a Composition
I created this GeoGebra
applet to help with visualization of the domain of a function defined by a composition.
Saturday, July 30, 2016
Exponential Models Card Sort

Saturday, May 2, 2015
Evaluating Inverse Trig Expressions
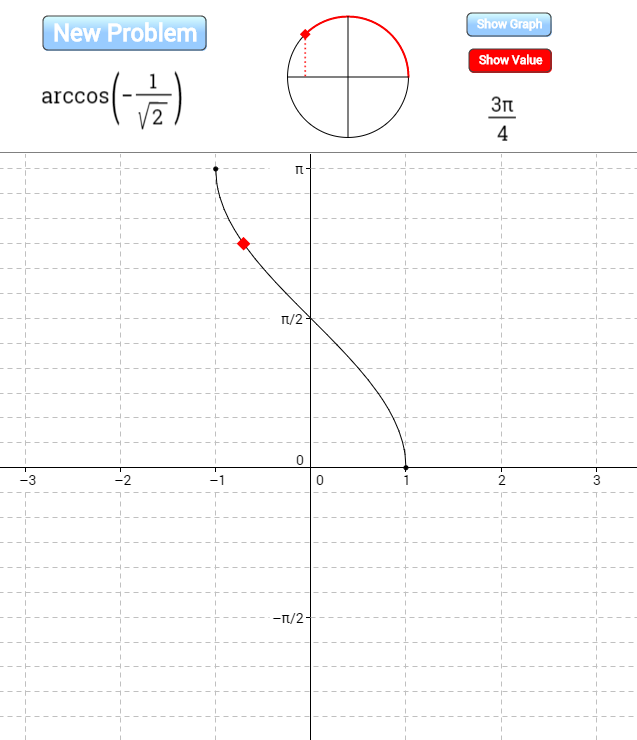 I created this applet on GeoGebraTube to help students practice evaluating inverse trig functions of special angles by visualizing both the unit circle and the graph of the inverse trig function.
Monday, March 30, 2015
Variation on John Golden's GeoGebra Ferris Wheel
 I love John Golden's GeoGebra Ferris Wheel, which he's written about here and I've written about here. I also love how GeoGebraTube makes it so easy to start with the great work of someone else and create a variation on it. Here's my variation on John's creation for a user who's slightly more experienced with transformations and with sine and cosine functions. Rather than asking the user to come up with parameters for a given function, it requires the user to come up with the whole function. I also added the option to hide the actual function so that the user could begin by thinking about what it would look like.
We had a great discussion in precalculus class today based on a single randomly generated wheel. We went wherever student questions and answers took us and ended up covering lots of ground. The particularly interesting stuff from my perspective came when those who saw the graph as a shifted sine wave were fighting it out with those who saw it as a shifted cosine wave and those who saw it as a flipped cosine wave. Finally lots of people were seeing lots of ways that they might write an equation for a sinusoidal wave. At the very end of class we generated a new wheel and everyone tried to write a function to go along with it. Class was over and people were pleading, "Please--try my equation!"
Thursday, March 19, 2015
Finding Equations of Polynomial and Rational Functions
 I created this activity with Desmos. Graphs of several polynomial and rational functions are provided. The goal is to find the equation of each. It's self-checking in that when you type in the right equation your graph will match the given graph.
Wednesday, July 10, 2013
Observe and Ask
 This simple Desmos sketch is designed to elicit observations and questions that will lead naturally to an introduction of the ideas of domain and range and an exploration of power functions. I show it to a class without any explanation and as I move the a-slider I ask for questions (which I write on the board, but don't answer). If students want the k-slider moved or if they want to see a particular value of a or k, I oblige. Eventually I ask students to begin trying to answer some of the questions and see where that takes us.
Friday, March 22, 2013
Operations on functions graphically

(Links updated 7/30/2016)
Inverse functions graphically

Thursday, July 26, 2012
Transforming f into g

In this applet (inspired by Steve Phelps' What's My Rule series) you select a parent function, f(x), from among 10 possibilities and click a button to indicate the maximum number of transformations (up to 4) that you'd like to have performed on f to produce a new function g. You see only one point on g, but you can move the corresponding point on f, to determine the relationship between the two. When you believe you have found the parameters that describe the transformation, you can show the graph of the transformed function that your parameters create and see if the lone point moves along it.
Here's a Java version of the applet.
Sunday, July 22, 2012
Ferris Wheel

Tuesday, July 17, 2012
Daylight Hours Explorer
 This Daylight Hours Explorer is from a fabulous collection of astronomy simulations and animations at the University of Nebraska at Lincoln. Exploring hours of daylight over the course of a year at various locations on the earth is a great way for students to think carefully about parameters of trig functions.
Thursday, June 21, 2012
Spinning Out Sine and Cosine
 A nice animation from the Wolfram Demonstrations Project showing the relationship between a circle and the graphs of sine and cosine. I like the way the cosine graph is show on its side. I'm going to try using it (after editing it in Mathematica to remove the sine and cosine labels) as an introduction both to the unit circle and the trig graphs. It looks like a good candidate for the technique of showing an animation with no commentary and then asking for student questions, writing them on the board, and asking for answers to/discussion of any of the questions.
Tuesday, June 12, 2012
Equation of a quadratic

Friday, June 18, 2010
Graph of a quartic
 In this GeoGebra applet, you graph a quartic by setting the values of the four zeros and the leading coefficient. The coordinates of all relative extrema are shown.
Thursday, December 17, 2009
Modeling with sine and cosine

In this applet, you look at the graph of a data set (for water level in Cape May, NJ on October 13, 2009) and try to fit a sine function and a cosine function to the data. You can type in your function to see how well it fits the data. Some instruction on how to determine the parameters is provided.
Sunday, December 6, 2009
Writing Equations for Sine and Cosine Functions

This applet I created with GeoGebra has 40 problems, which get progressively more difficult, in which the student must write an equation for a graph which is a stretch and/or translation of a sine/cosine graph. To check whether an equation is correct, the student types in the equation and looks at whether the graphs match up.
Wednesday, June 24, 2009
Connecting exponential equations and their graphs
 This is a Geogebra applet created by Steve Phelps in which you construct the graph of an exponential function by placing the asymptote, the y-intercept and one other point. You then type in what you think the graph of your equation ought to be. The equation you type in is graphed so you can see if you're right.
Sunday, July 27, 2008
Graph Explorer

This applet allows you to graph multiple functions in different colors and to zoom in and out easily. A nice feature is that you can define parameters (e.g., m and b in y = mx + b) and then vary their values using a slider and watch the graph change.
Thursday, July 24, 2008
Algebra Arrows
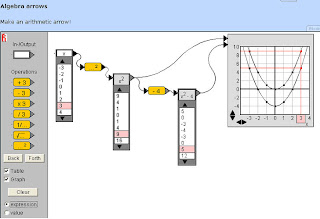
This is a very cool applet from WisWeb for illustrating the building of an algebraic function and the relationship between tabular and graphical representations of the function. I didn't find much in the way of instructions on the website (much of which is in Dutch, though there is a more limited English version), but try this to build graphs and tables for y = x, y = x^2, and y = x^2 - 4:
1. Drag an In-/Output box to the main area of the applet and type an x in it.
2. Check both the Table and Graph check boxes. A table of values will appear with your In-/Output box and a blank graph will appear.
3. Drag the yellow "squared" operator into the main area.
4. Drag the arrow on the In-/Output box until it connects with the tiny gray dot on the operator box.
5. Add another In-/Output box and drag the operator arrow to connect with the little gray dot on this new box. The table below this box now shows the squares of all the values in the table below your original In-Output box.
6. Drag the arrow on the new In-/Output box over to the graph and the graph of y = x^2 appears. (Click and drag on the graph to see different portions of the graph and use the arrows to change the scales on the axes.) If you click one of the numbers in the tables, the corresponding number in the other table and the corresponding point on the graph will be highlighted.
7. Drag the subtraction operator into the main area and change its 3 to a 4.
8. Connect the x^2 In-/Output box to the subtraction operator.
9. Add another In-/Output box and connect the subtraction operator to it to see a table of values for x^2 - 4. Connect this new In-/Output box to the graph to show its graph as well as the original graph.
Subscribe to:
Posts (Atom)