
Showing posts with label precalculus. Show all posts
Showing posts with label precalculus. Show all posts
Sunday, August 6, 2017
Domain of a Function defined by a Composition
I created this GeoGebra
applet to help with visualization of the domain of a function defined by a composition.
Thursday, January 5, 2017
Snail's Trail Quilt Square
 I created this GeoGebra applet based on a quilt square pattern to use in a precalculus class as a visual introduction to the sum of an infinite geometric series. A nice accompaniment is this applet from Irina Boyadzhiev. I also created a Desmos activity with a focus on asking questions which incorporates these two applets.
Sunday, August 21, 2016
Visualizing radians
 Sam Shah shared a GeoGebra applet created by a colleage of his which does a beautiful job of demonstrating what a radian is. He wrote about it here. I made minor modifications, mostly so that the word radian doesn't actually appear. Here's that slightly modified version.
Saturday, July 30, 2016
Exponential Models Card Sort

Monday, March 30, 2015
Variation on John Golden's GeoGebra Ferris Wheel
 I love John Golden's GeoGebra Ferris Wheel, which he's written about here and I've written about here. I also love how GeoGebraTube makes it so easy to start with the great work of someone else and create a variation on it. Here's my variation on John's creation for a user who's slightly more experienced with transformations and with sine and cosine functions. Rather than asking the user to come up with parameters for a given function, it requires the user to come up with the whole function. I also added the option to hide the actual function so that the user could begin by thinking about what it would look like.
We had a great discussion in precalculus class today based on a single randomly generated wheel. We went wherever student questions and answers took us and ended up covering lots of ground. The particularly interesting stuff from my perspective came when those who saw the graph as a shifted sine wave were fighting it out with those who saw it as a shifted cosine wave and those who saw it as a flipped cosine wave. Finally lots of people were seeing lots of ways that they might write an equation for a sinusoidal wave. At the very end of class we generated a new wheel and everyone tried to write a function to go along with it. Class was over and people were pleading, "Please--try my equation!"
Friday, March 20, 2015
Asymptotes of Rational Functions.
 Asymptotes of Rational Functions is a GeoGebra construction designed to help people explore the relationship between the equation of a rational function and its graph. You choose the rational function you'd like to explore. Here's a story of something neat that happened when I used it in class.
Thursday, March 19, 2015
Finding Equations of Polynomial and Rational Functions
 I created this activity with Desmos. Graphs of several polynomial and rational functions are provided. The goal is to find the equation of each. It's self-checking in that when you type in the right equation your graph will match the given graph.
Wednesday, July 10, 2013
Observe and Ask
 This simple Desmos sketch is designed to elicit observations and questions that will lead naturally to an introduction of the ideas of domain and range and an exploration of power functions. I show it to a class without any explanation and as I move the a-slider I ask for questions (which I write on the board, but don't answer). If students want the k-slider moved or if they want to see a particular value of a or k, I oblige. Eventually I ask students to begin trying to answer some of the questions and see where that takes us.
Tuesday, April 2, 2013
Puzzle
 Can you figure out how the p and q sliders control the lines? To check your answer, try typing in equations of the lines (in terms of p and q) in the blank rows underneath the sliders and see if the lines that your equations produce match the lines that are already there. (When you've found something that works--but not before, that's cheating!--you can scroll down to rows below the blank ones to see if your equations are the same as the ones that were actually used to produce the lines.)
Friday, March 22, 2013
Operations on functions graphically

(Links updated 7/30/2016)
Finding logs

Inverse functions graphically

Mathmo

I did experience a couple of minor bugs. Sometimes, the first time you look at a question you see the code rather than the mathematical notation. Clicking (or tapping) the question changes the code to notation. The description says that the color of the question changes once you indicate whether you got the question right or wrong. I didn't experience that either on the iPad or in Chrome.
Sunday, July 22, 2012
Ferris Wheel

Saturday, July 21, 2012
Napier's Gift

Saturday, July 7, 2012
Indiana Puzzle Quilt

Check out the pattern in some real quilts, too!
Update 1/5/2017: See the Snail's Trail Quilt Square
Friday, July 1, 2011
Rational Function Graphs
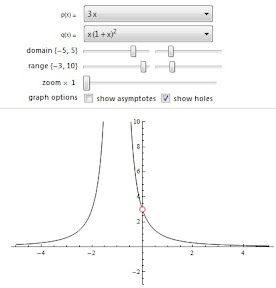 Use this demonstration from the Wolfram Demonstrations Project to explore the graphs of rational functions. Predict whether the function will have any holes and then check "show holes" to see if you're right. (To interact with it online you'll need to download and install Wolfram's free CDF Player.)
Saturday, July 31, 2010
Law of Sines and Law of Cosines

Vectors in the Ocean

Friday, June 18, 2010
Graph of a quartic
 In this GeoGebra applet, you graph a quartic by setting the values of the four zeros and the leading coefficient. The coordinates of all relative extrema are shown.
Subscribe to:
Posts (Atom)