Showing posts with label modeling. Show all posts
Showing posts with label modeling. Show all posts
Saturday, July 30, 2016
Exponential Models Card Sort
Thanks to the ever-innovative-and-tuned-in-to-what-teachers-would-love-to-have Desmos team, I've created an online version of a card sort that I originally developed in paper form to help precalculus students think carefully about the meaning of the parameters in various forms of exponential equations. See this blog post for more detail on the context in which I use this.
Monday, March 30, 2015
Variation on John Golden's GeoGebra Ferris Wheel
 I love John Golden's GeoGebra Ferris Wheel, which he's written about here and I've written about here. I also love how GeoGebraTube makes it so easy to start with the great work of someone else and create a variation on it. Here's my variation on John's creation for a user who's slightly more experienced with transformations and with sine and cosine functions. Rather than asking the user to come up with parameters for a given function, it requires the user to come up with the whole function. I also added the option to hide the actual function so that the user could begin by thinking about what it would look like.
We had a great discussion in precalculus class today based on a single randomly generated wheel. We went wherever student questions and answers took us and ended up covering lots of ground. The particularly interesting stuff from my perspective came when those who saw the graph as a shifted sine wave were fighting it out with those who saw it as a shifted cosine wave and those who saw it as a flipped cosine wave. Finally lots of people were seeing lots of ways that they might write an equation for a sinusoidal wave. At the very end of class we generated a new wheel and everyone tried to write a function to go along with it. Class was over and people were pleading, "Please--try my equation!"
Sunday, July 22, 2012
Ferris Wheel
This is a full-featured and beautifully designed GeoGebra applet from John Golden that allows students to practice fitting parameters to a cosine function which models the height of a ferris wheel car above the ground as a function of time. You can watch the ferris wheel spin as the height curve is generated and it provides an endless source of practice since you can always generate a new ferris wheel.
Tuesday, July 17, 2012
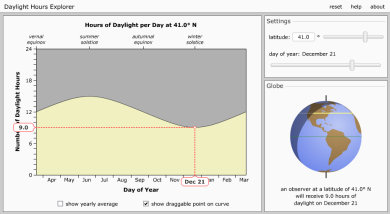
Daylight Hours Explorer
 This Daylight Hours Explorer is from a fabulous collection of astronomy simulations and animations at the University of Nebraska at Lincoln. Exploring hours of daylight over the course of a year at various locations on the earth is a great way for students to think carefully about parameters of trig functions.
Saturday, July 31, 2010
Vectors in the Ocean
This applet provides an introduction to the vector equation of a line in the context of a boat traveling in the ocean. You specify the position vector and the velocity vector and then watch how the boat moves and the equation changes as the time changes. (Making the ocean visible sets the mood, but turning it off makes it easier to see what's happening!)
Friday, July 23, 2010
Vertical Motion Simulation
 This GeoGebra applet by Linda Fahlberg-Stojanovska simulates the motion of a projectile fired either straight up or straight down on Earth in the absence of air resistance. The user sets the initial height and the initial velocity and indicates whether units of measure should be feet or meters. You see the motion of the ball along the vertical axis, while the height as a function of time is plotted for you.
Thursday, December 17, 2009
Modeling with sine and cosine

In this applet, you look at the graph of a data set (for water level in Cape May, NJ on October 13, 2009) and try to fit a sine function and a cosine function to the data. You can type in your function to see how well it fits the data. Some instruction on how to determine the parameters is provided.
Subscribe to:
Posts (Atom)


