
Showing posts with label trigonometry. Show all posts
Showing posts with label trigonometry. Show all posts
Saturday, August 4, 2018
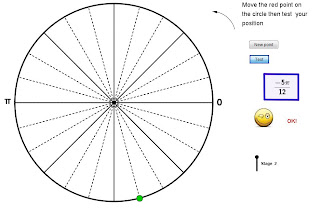
Unit Circle Practice
Sunday, August 21, 2016
Visualizing radians
 Sam Shah shared a GeoGebra applet created by a colleage of his which does a beautiful job of demonstrating what a radian is. He wrote about it here. I made minor modifications, mostly so that the word radian doesn't actually appear. Here's that slightly modified version.
Saturday, May 2, 2015
Evaluating Inverse Trig Expressions
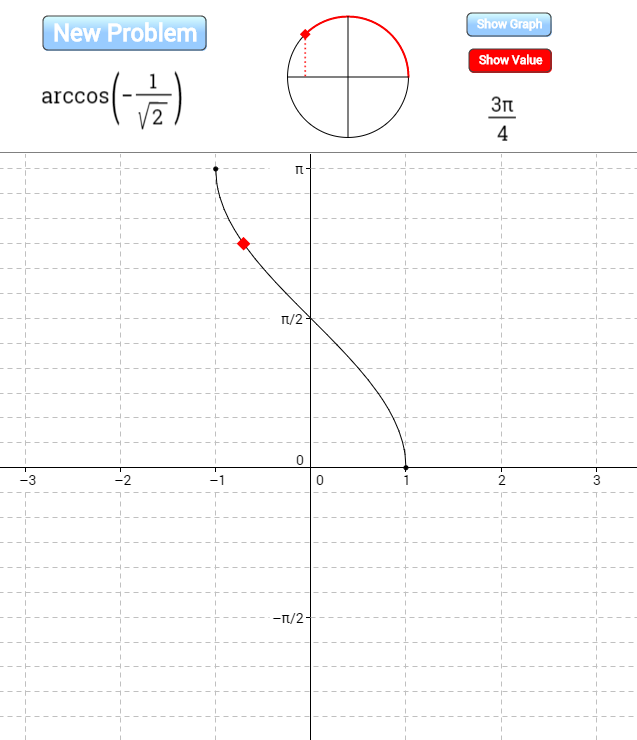 I created this applet on GeoGebraTube to help students practice evaluating inverse trig functions of special angles by visualizing both the unit circle and the graph of the inverse trig function.
Monday, March 30, 2015
Variation on John Golden's GeoGebra Ferris Wheel
 I love John Golden's GeoGebra Ferris Wheel, which he's written about here and I've written about here. I also love how GeoGebraTube makes it so easy to start with the great work of someone else and create a variation on it. Here's my variation on John's creation for a user who's slightly more experienced with transformations and with sine and cosine functions. Rather than asking the user to come up with parameters for a given function, it requires the user to come up with the whole function. I also added the option to hide the actual function so that the user could begin by thinking about what it would look like.
We had a great discussion in precalculus class today based on a single randomly generated wheel. We went wherever student questions and answers took us and ended up covering lots of ground. The particularly interesting stuff from my perspective came when those who saw the graph as a shifted sine wave were fighting it out with those who saw it as a shifted cosine wave and those who saw it as a flipped cosine wave. Finally lots of people were seeing lots of ways that they might write an equation for a sinusoidal wave. At the very end of class we generated a new wheel and everyone tried to write a function to go along with it. Class was over and people were pleading, "Please--try my equation!"
Friday, March 22, 2013
Inverse functions graphically

Mathmo

I did experience a couple of minor bugs. Sometimes, the first time you look at a question you see the code rather than the mathematical notation. Clicking (or tapping) the question changes the code to notation. The description says that the color of the question changes once you indicate whether you got the question right or wrong. I didn't experience that either on the iPad or in Chrome.
Monday, December 3, 2012
Radian measure practice
Thursday, July 26, 2012
Transforming f into g

In this applet (inspired by Steve Phelps' What's My Rule series) you select a parent function, f(x), from among 10 possibilities and click a button to indicate the maximum number of transformations (up to 4) that you'd like to have performed on f to produce a new function g. You see only one point on g, but you can move the corresponding point on f, to determine the relationship between the two. When you believe you have found the parameters that describe the transformation, you can show the graph of the transformed function that your parameters create and see if the lone point moves along it.
Here's a Java version of the applet.
Sunday, July 22, 2012
Ferris Wheel

Tuesday, July 17, 2012
Daylight Hours Explorer
 This Daylight Hours Explorer is from a fabulous collection of astronomy simulations and animations at the University of Nebraska at Lincoln. Exploring hours of daylight over the course of a year at various locations on the earth is a great way for students to think carefully about parameters of trig functions.
Monday, July 16, 2012
Visualizing Radian Measure

Thursday, June 21, 2012
Spinning Out Sine and Cosine
 A nice animation from the Wolfram Demonstrations Project showing the relationship between a circle and the graphs of sine and cosine. I like the way the cosine graph is show on its side. I'm going to try using it (after editing it in Mathematica to remove the sine and cosine labels) as an introduction both to the unit circle and the trig graphs. It looks like a good candidate for the technique of showing an animation with no commentary and then asking for student questions, writing them on the board, and asking for answers to/discussion of any of the questions.
Saturday, July 31, 2010
Law of Sines and Law of Cosines

Thursday, December 17, 2009
Modeling with sine and cosine

In this applet, you look at the graph of a data set (for water level in Cape May, NJ on October 13, 2009) and try to fit a sine function and a cosine function to the data. You can type in your function to see how well it fits the data. Some instruction on how to determine the parameters is provided.
Sunday, December 6, 2009
Writing Equations for Sine and Cosine Functions

This applet I created with GeoGebra has 40 problems, which get progressively more difficult, in which the student must write an equation for a graph which is a stretch and/or translation of a sine/cosine graph. To check whether an equation is correct, the student types in the equation and looks at whether the graphs match up.
Wednesday, September 9, 2009
Blank Axes for Trig Graphs

Blank axes designed to make it easy to create standard trig graphs for insertion into word processing documents. The full power of Geogebra is behind it. To copy the graph you've made, choose "Graphics View to Clipboard" from the Edit menu.
Sunday, June 21, 2009
Introduction to the Unit Circle
 These are three versions of an applet that I created using GeoGebra to introduce students to the unit circle. One version presents the idea in terms of distance traveled around the circle. The other two present the idea in terms of the measure of the central angle. There is a radian version and a degree version.
Tuesday, July 24, 2007
Quizlet

Of the flashcard sites I've explored, this one is the best I've found for allowing the input of mathematical notation. You need to register (free) to create cards, but others can use your cards without registering. There are lots of good options for working with cards you've created. The interface for basic card viewing and flipping works very smoothly and quickly. Want to try it? Experiment with my cards on sines and cosines and evaluating inverse trig expressions.
Subscribe to:
Posts (Atom)