 I created this Desmos activity to help students understand point-slope form of a linear equation, both how it relates to the equation for calculating the slope between two points and why it might be useful even if you're already good at slope-intercept form. It also introduces the idea of calling the change in x by the name h.
Showing posts with label graphing. Show all posts
Showing posts with label graphing. Show all posts
Saturday, July 23, 2016
Introduction to Point-Slope Form
I created this Desmos activity to help students understand point-slope form of a linear equation, both how it relates to the equation for calculating the slope between two points and why it might be useful even if you're already good at slope-intercept form. It also introduces the idea of calling the change in x by the name h. Saturday, May 2, 2015
Evaluating Inverse Trig Expressions
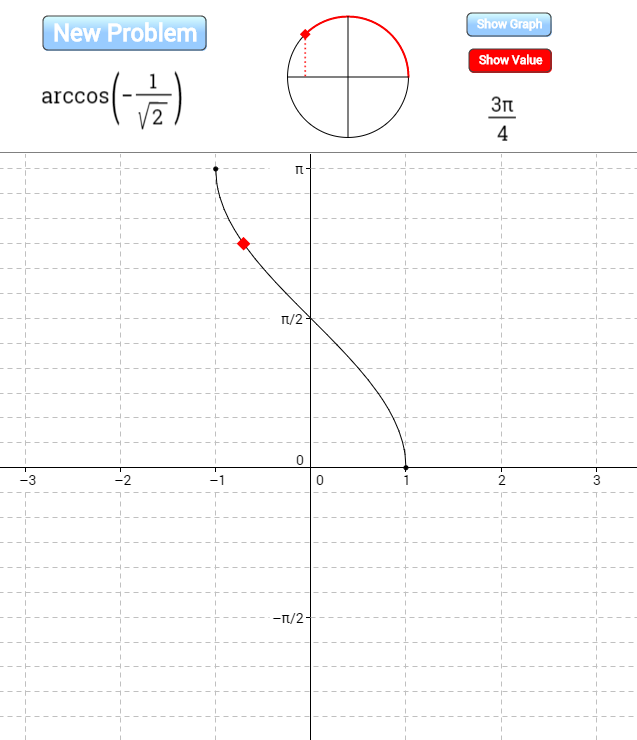 I created this applet on GeoGebraTube to help students practice evaluating inverse trig functions of special angles by visualizing both the unit circle and the graph of the inverse trig function.
Monday, March 30, 2015
Variation on John Golden's GeoGebra Ferris Wheel
 I love John Golden's GeoGebra Ferris Wheel, which he's written about here and I've written about here. I also love how GeoGebraTube makes it so easy to start with the great work of someone else and create a variation on it. Here's my variation on John's creation for a user who's slightly more experienced with transformations and with sine and cosine functions. Rather than asking the user to come up with parameters for a given function, it requires the user to come up with the whole function. I also added the option to hide the actual function so that the user could begin by thinking about what it would look like.
We had a great discussion in precalculus class today based on a single randomly generated wheel. We went wherever student questions and answers took us and ended up covering lots of ground. The particularly interesting stuff from my perspective came when those who saw the graph as a shifted sine wave were fighting it out with those who saw it as a shifted cosine wave and those who saw it as a flipped cosine wave. Finally lots of people were seeing lots of ways that they might write an equation for a sinusoidal wave. At the very end of class we generated a new wheel and everyone tried to write a function to go along with it. Class was over and people were pleading, "Please--try my equation!"
Friday, March 20, 2015
Asymptotes of Rational Functions.
 Asymptotes of Rational Functions is a GeoGebra construction designed to help people explore the relationship between the equation of a rational function and its graph. You choose the rational function you'd like to explore. Here's a story of something neat that happened when I used it in class.
Thursday, March 19, 2015
Finding Equations of Polynomial and Rational Functions
 I created this activity with Desmos. Graphs of several polynomial and rational functions are provided. The goal is to find the equation of each. It's self-checking in that when you type in the right equation your graph will match the given graph.
Friday, March 22, 2013
Inverse functions graphically

Sunday, July 22, 2012
Ferris Wheel

Thursday, June 21, 2012
Spinning Out Sine and Cosine
 A nice animation from the Wolfram Demonstrations Project showing the relationship between a circle and the graphs of sine and cosine. I like the way the cosine graph is show on its side. I'm going to try using it (after editing it in Mathematica to remove the sine and cosine labels) as an introduction both to the unit circle and the trig graphs. It looks like a good candidate for the technique of showing an animation with no commentary and then asking for student questions, writing them on the board, and asking for answers to/discussion of any of the questions.
Sunday, May 6, 2012
Contour Plots
 This is a well-designed tool for creating and exploring contour plots. It has nice customization options and you can save your plots in a wide range of formats. It comes from Bulgaria and Macedonia's Computational Science and Engineering Program.
Friday, November 25, 2011
Sketch the Graph of an Antiderivative

Saturday, July 23, 2011
Find the equation of a line
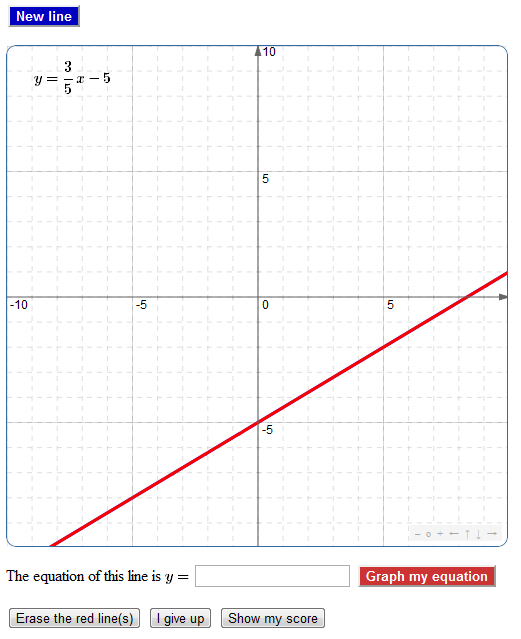 In this applet a line is randomly generated and the user enters what she thinks the equation is. Her equation is then graphed for comparison with the original. There is a scoring mechanism incorporated as well.
This is my first applet created with JSXGraph , which looks quite promising (though it does require learning Javascript.)
Particularly helpful to me in developing this were Dr. Carol Fisher's Reference on JSXGraph Commands and the convert-to-math script in use at interactive mathematics. (The latter enables the user to enter the equation using standard calculator notation.) I also found the javascript tutorial at w3schools.com a very useful introduction to javascript.
The application uses MathJax to produce nice mathematical notation.
Friday, July 1, 2011
Rational Function Graphs
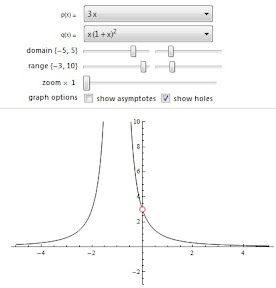 Use this demonstration from the Wolfram Demonstrations Project to explore the graphs of rational functions. Predict whether the function will have any holes and then check "show holes" to see if you're right. (To interact with it online you'll need to download and install Wolfram's free CDF Player.)
Polar and Rectangular Coordinates

Monday, March 21, 2011
Calculus Grapher
 A nice applet from the PhET project at the University of Colorado enabling you to quickly "sketch" a graph of a particular shape and to see graphs of its derivative and integral.
Saturday, July 31, 2010
Vectors in the Ocean

Friday, July 23, 2010
WolframAlpha

Friday, June 18, 2010
Graph of a quartic
 In this GeoGebra applet, you graph a quartic by setting the values of the four zeros and the leading coefficient. The coordinates of all relative extrema are shown.
Sunday, December 6, 2009
Writing Equations for Sine and Cosine Functions

This applet I created with GeoGebra has 40 problems, which get progressively more difficult, in which the student must write an equation for a graph which is a stretch and/or translation of a sine/cosine graph. To check whether an equation is correct, the student types in the equation and looks at whether the graphs match up.
Tuesday, October 6, 2009
Finding the equation of a parabola

This is an applet I created using Geogebra in which the user is asked to enter the equation of randomly generated parabola. The equation entered is graphed for comparison to the target parabola.
Wednesday, September 9, 2009
Blank Axes for Trig Graphs

Blank axes designed to make it easy to create standard trig graphs for insertion into word processing documents. The full power of Geogebra is behind it. To copy the graph you've made, choose "Graphics View to Clipboard" from the Edit menu.
Subscribe to:
Posts (Atom)