 I created this Desmos activity to help students understand point-slope form of a linear equation, both how it relates to the equation for calculating the slope between two points and why it might be useful even if you're already good at slope-intercept form. It also introduces the idea of calling the change in x by the name h.
Showing posts with label graphs. Show all posts
Showing posts with label graphs. Show all posts
Saturday, July 23, 2016
Introduction to Point-Slope Form
I created this Desmos activity to help students understand point-slope form of a linear equation, both how it relates to the equation for calculating the slope between two points and why it might be useful even if you're already good at slope-intercept form. It also introduces the idea of calling the change in x by the name h. Saturday, May 2, 2015
Evaluating Inverse Trig Expressions
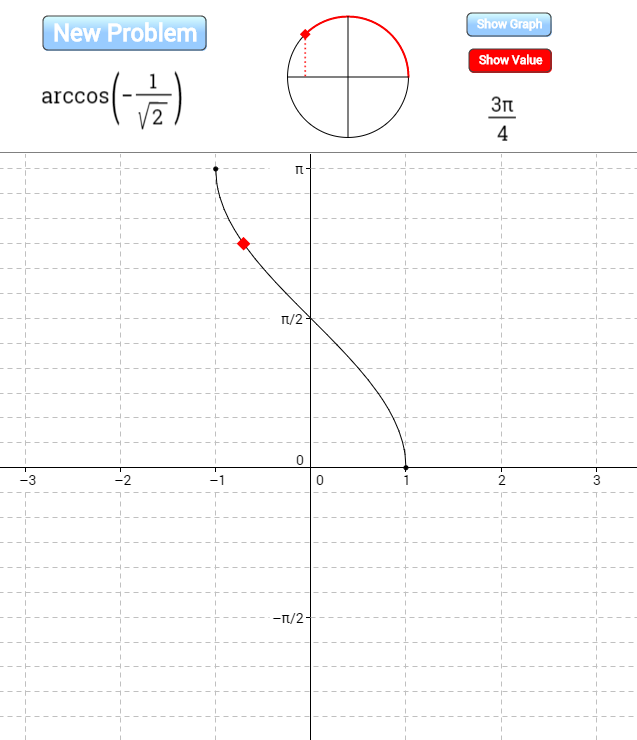 I created this applet on GeoGebraTube to help students practice evaluating inverse trig functions of special angles by visualizing both the unit circle and the graph of the inverse trig function.
Monday, March 30, 2015
Variation on John Golden's GeoGebra Ferris Wheel
 I love John Golden's GeoGebra Ferris Wheel, which he's written about here and I've written about here. I also love how GeoGebraTube makes it so easy to start with the great work of someone else and create a variation on it. Here's my variation on John's creation for a user who's slightly more experienced with transformations and with sine and cosine functions. Rather than asking the user to come up with parameters for a given function, it requires the user to come up with the whole function. I also added the option to hide the actual function so that the user could begin by thinking about what it would look like.
We had a great discussion in precalculus class today based on a single randomly generated wheel. We went wherever student questions and answers took us and ended up covering lots of ground. The particularly interesting stuff from my perspective came when those who saw the graph as a shifted sine wave were fighting it out with those who saw it as a shifted cosine wave and those who saw it as a flipped cosine wave. Finally lots of people were seeing lots of ways that they might write an equation for a sinusoidal wave. At the very end of class we generated a new wheel and everyone tried to write a function to go along with it. Class was over and people were pleading, "Please--try my equation!"
Friday, March 20, 2015
Asymptotes of Rational Functions.
 Asymptotes of Rational Functions is a GeoGebra construction designed to help people explore the relationship between the equation of a rational function and its graph. You choose the rational function you'd like to explore. Here's a story of something neat that happened when I used it in class.
Thursday, March 19, 2015
Finding Equations of Polynomial and Rational Functions
 I created this activity with Desmos. Graphs of several polynomial and rational functions are provided. The goal is to find the equation of each. It's self-checking in that when you type in the right equation your graph will match the given graph.
Friday, March 22, 2013
Inverse functions graphically

Thursday, July 26, 2012
Transforming f into g

In this applet (inspired by Steve Phelps' What's My Rule series) you select a parent function, f(x), from among 10 possibilities and click a button to indicate the maximum number of transformations (up to 4) that you'd like to have performed on f to produce a new function g. You see only one point on g, but you can move the corresponding point on f, to determine the relationship between the two. When you believe you have found the parameters that describe the transformation, you can show the graph of the transformed function that your parameters create and see if the lone point moves along it.
Here's a Java version of the applet.
Tuesday, June 12, 2012
Equation of a quadratic

Subscribe to:
Posts (Atom)